CLM & CVM
Customer Lifecycle and Customer Value Management 5/5: Reactivate
Part 5 of the five-part series: How banks distinguish dormancy, choose suitable treatments and measure reactivation incrementally.
•
acceleraid Editorial Team
5 min read

This article is part of a six-piece reading path comprising one lead article and five operating phases:
The CVM series at a glance
Dormant is not terminated
Between active use and formal closure lies dormancy: an existing relationship without the expected activity. There is no universal time window. A current account, credit card and savings product have different natural rhythms, and seasonal usage must not be confused with disengagement.
The definition should therefore contain three elements: a product-specific observation window, deviation from the individual baseline and exclusion rules for known seasonality or operational blocks. Only then does dormancy become a useful steering signal.
Why reactivation pays off economically
Robust bank-specific DACH benchmarks for reactivation by inactivity window are scarcely available in the public domain. The frequently quoted rates of 20 to 40 per cent and claims of higher customer lifetime value largely originate in cross-industry vendor publications. We therefore do not use them as performance promises.
The economic test must be internal and incremental: how much additional sustained usage does a treatment create versus a comparable holdout group, after incentive, contact and operating costs? Established retention logic supplies the hypothesis, not an automatic reactivation ROI (Harvard Business Review ↗).
Reactivation Journeys: from detection to action
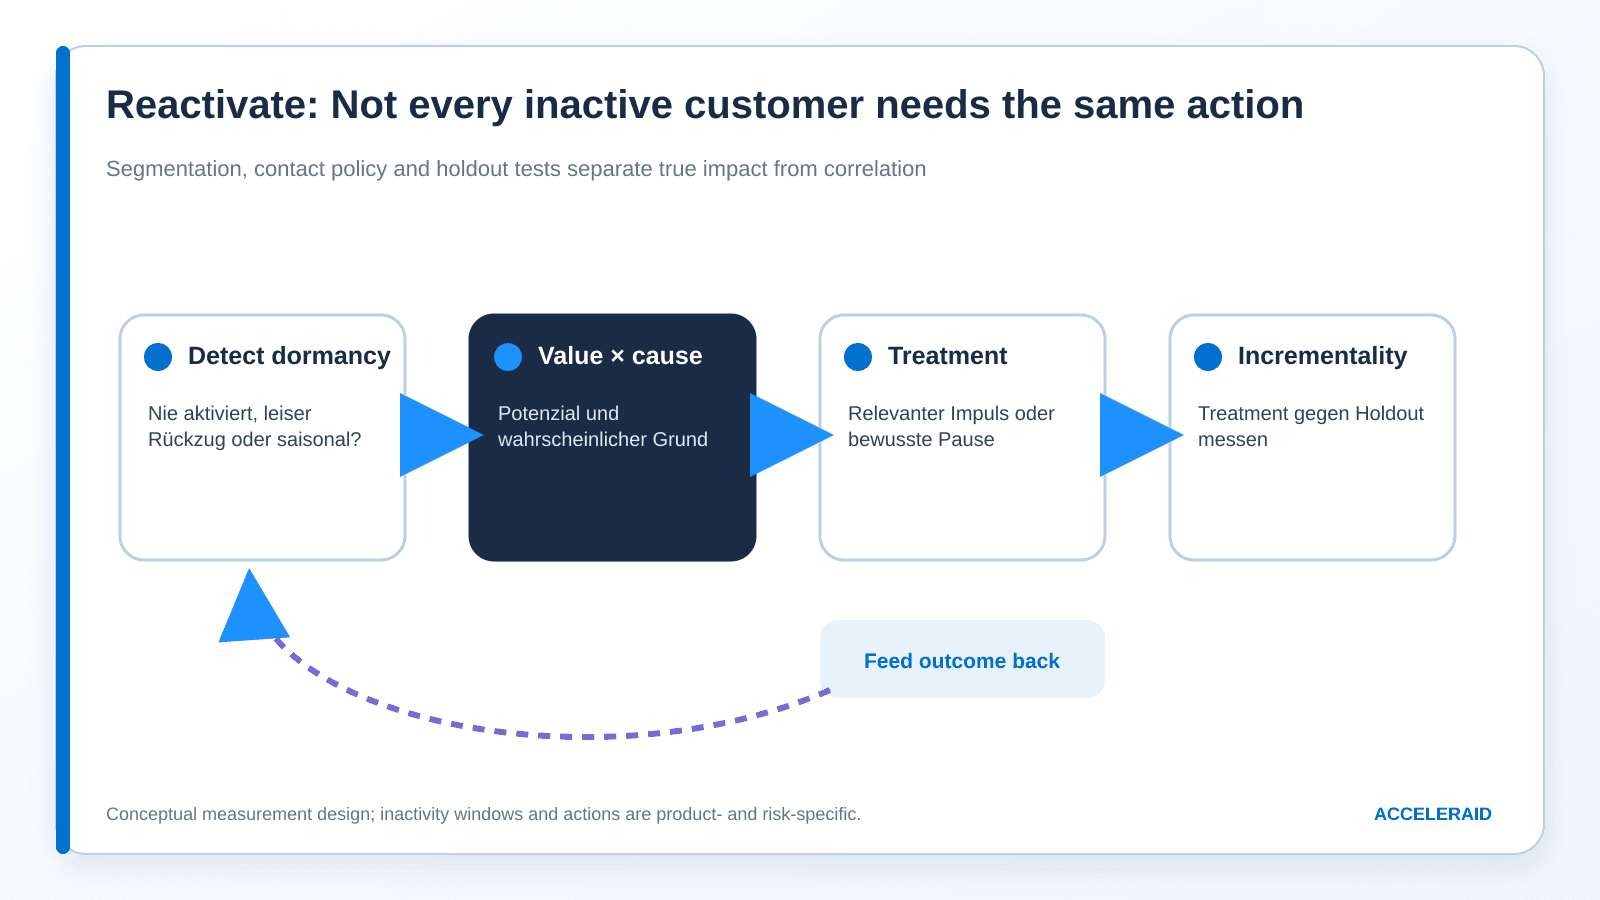
A robust journey starts not with a message but with a causal hypothesis. The bank first detects a meaningful deviation from the individual or segment baseline. It then distinguishes at least four situations before selecting a treatment.
Situation | Typical pattern | Appropriate response |
|---|---|---|
Never activated | Product opened, but no robust start of usage | Identify friction and restore functionality |
Seasonal | Recurring pauses without value migration | Avoid contact or time it appropriately |
Gradual disengagement | Activity, balance or inflows decline over time | Cause-related support or advice |
Operationally blocked | Card, access, KYC or service issue prevents use | Solve the problem rather than escalate marketing |
Permitted treatments, exclusions, channel preferences and contact frequencies are defined for each segment. High historical value does not automatically justify more contact. Complaints, active fraud cases, payment difficulties or an explicit communication preference may exclude promotional outreach and require a service process instead.
The journey does not end with a click. A return counts as reactivation only when a product-specific usage event occurs and persists over a meaningful follow-up window. The outcome flows back: which cause was likely, which treatment was permitted, which channel worked and what incremental value resulted? This turns a one-off win-back attempt into a controlled learning loop.
Technically, the flow connects the same signals as the Retain phase with a stricter decision logic. The Acceleraid platform is designed to combine scores, lifecycle phase, contact rules and channel execution; the actual effect must still be measured for each bank and use case (Acceleraid Platform ↗).
Measurement and attribution per campaign and channel
An observed return after a message does not prove impact. Some customers would have returned without contact. Every reactivation journey therefore needs a randomised or methodologically sound holdout group.
Measure | Definition | Why it matters |
|---|---|---|
Incremental reactivation | Treatment reactivation rate minus holdout | Separates impact from organic return |
Sustained usage | Activity after a defined follow-up window | Prevents short-lived false success |
Incremental value | Additional contribution minus treatment cost | Connects the journey with the business case |
Contact burden | Contacts, opt-outs and complaints | Limits negative side effects |
First-party data and journey-based measurement help attribution, but do not replace a controlled comparison (Braze ↗). The feedback loop should return outcome, cost and side effects to segmentation and contact policy.
Conclusion: five phases, one consistent logic
This series has traced the customer lifecycle in retail banking through five phases: data-driven acquisition via personalized landing pages (Part 1), activation in the critical first 90 days (Part 2), event-driven engagement through life events and transaction data (Part 3), early detection of churn risk (Part 4) and finally the reactivation of dormant, still existing customer relationships. The common denominator of all five phases is the same: behavioral data from transactions and digital usage behavior provide the signals, a prediction engine translates them into scores, and an orchestration layer selects the next best action across all phases — consistently, explainably and delivered via the right channel.
Legal guardrails for reactivation in Germany
Reactivation is not automatically permitted merely because a customer relationship still exists technically. For promotional email, the existing-customer exception in Section 7(3) of the German Unfair Competition Act applies only when all four conditions are met together: the address was obtained in connection with a sale, it is used for the organisation's own similar products or services, the customer has not objected, and the right to object was clearly explained both when the address was collected and whenever it is used (Section 7 UWG ↗).
Where processing relies on legitimate interests under Article 6(1)(f) GDPR, the European Data Protection Board requires three cumulative tests: a lawful, clearly articulated and present interest; necessity of the processing for that purpose; and a balancing exercise against the individual's rights and reasonable expectations. The assessment must be purpose-specific, documented before processing and cannot treat legitimate interest as a general fallback (EDPB Guidelines 1/2024 ↗).
Operationally, channel permission, purpose, product similarity, objections, contact frequency and sensitive exclusions must become machine-readable journey rules. A high reactivation score must never override an impermissible contact.
Implementation plan: from signal to controlled pilot
A sensible pilot starts with one product and a tightly defined cohort. Dormancy, exclusions and the desired usage event are defined first. A backtest then checks whether the selected signals identify the target early and consistently enough. Only after that foundation is established are treatment and holdout assigned at random.
Pilot steering should connect at least four perspectives: model quality, operational reachability, customer outcome and economics. A precise model remains worthless when no permitted or helpful action exists. Conversely, a high response rate can be problematic when it depends on heavy incentives, creates complaints or disappears after a few days.
After the pilot, the team documents not only campaign outcomes but also errors: customers incorrectly marked dormant, organic return in the holdout group, unreachable channels and cases where a service intervention would have been better. These lessons change the definition, thresholds and contact policy before the next rollout.
Five key takeaways
Dormancy is an observable state, not a single cause.
Inactivity windows must be defined by product, usage pattern and risk.
Never-activated, seasonal and gradually disengaging customers need different treatments.
A reactivation rate alone does not prove impact.
Holdout groups and sustained usage after return are the decisive measures.
Illustration: AI-generated. AI-supported content: In creating our articles, we use AI technologies and automated agents, including those from Microsoft, Google, OpenAI, Anthropic and other providers. Topics, professional orientation and final approval rest with our team.
