CLM & CVM
Customer Lifecycle and Customer Value Management 4/5: Retain
Part 4 of the five-part series: How behavioural signals, explainable scores and measurable interventions form a retention early-warning system.
•
acceleraid Editorial Team
5 min read

This article is part of a six-piece reading path comprising one lead article and five operating phases:
The CVM series at a glance
The customers nobody sees leaving
Retail-banking attrition often appears first not as formal closure but as a shift in the primary-bank relationship: fewer transactions, declining balances, a missing salary payment or lower digital usage. Such behavioural changes are more useful for an early-warning system than a broad “silent attrition” percentage that has not been validated across banks.
A study by Kaya, Dong, Suhara and colleagues examines attrition dynamics with behavioural data and demonstrates the value of temporal usage patterns for modelling (EPJ Data Science ↗). The target still has to be defined internally: account closure, loss of primary status, a substantial activity decline, or a combination.
Why retention carries so much economic weight
Retention matters economically, but frequently repeated acquisition-cost and profit multiples originate in old or secondary sources and do not constitute a robust banking business case. A better approach links the risk signal directly to prevented attrition, contribution margin and intervention cost.
A large Brazilian banking study using roughly 170 million transactions and more than three million customers shows why temporal variables matter. Recency of a credit purchase accounted for 46.23 per cent of feature importance, while feature engineering improved separation more than changing the model alone. Churners already held a median 62 per cent of their business elsewhere (Financial Innovation 10:17, 2024 ↗).
This is strong feasibility evidence, not a German market benchmark. A German bank must calculate the business case with its own margins, contact pressure, incentives and holdout outcome.
What a churn propensity score actually measures
A churn propensity estimates, for a clearly defined cohort, the probability of an equally well-defined event within a fixed horizon. Robust models combine several behavioural dimensions:
Transaction frequency: change from the individual baseline.
Balance development: gradual movement of funds or inflows.
Digital engagement: declining use of relevant functions.
Product and channel signals: expiry, non-use or unresolved service events.
Published modelling studies can demonstrate technical feasibility, but very high accuracy on an individual dataset does not transfer directly to a bank. Temporal validation, class imbalance, calibration, explainability and the incremental effect of the triggered treatment matter most. A recent modelling study provides methodological input, not a production benchmark (Data Science in Finance and Economics ↗).
Thresholds and the 90-day window
A score alone achieves nothing — what matters is how early it is translated into clearly defined action thresholds. In practice, several escalation levels can be distinguished: a baseline phase where a customer appears normal; an early signal phase where individual indicators deteriorate without a clear pattern; an escalation stage where multiple signals drop simultaneously; and a critical phase shortly before actual churn, where many traditional reactivation measures are already too late.
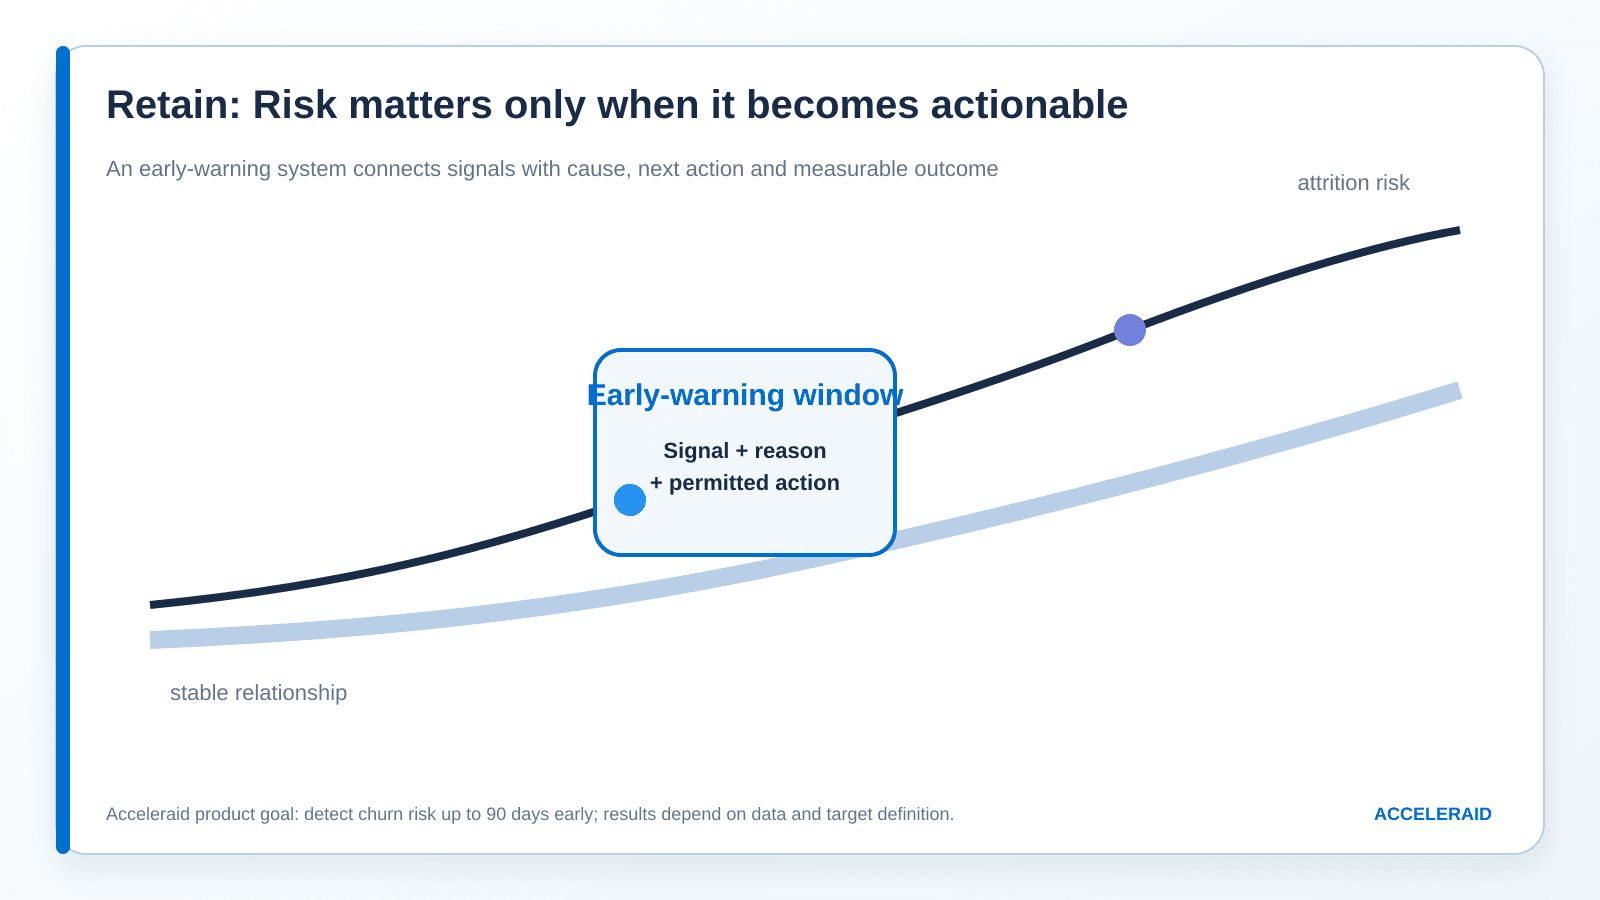
The earlier a score is translated into an actionable threshold, the larger the remaining window of opportunity. The Acceleraid Prediction Engine is designed to detect churn risk up to 90 days in advance — a timeframe sufficient to plan and deliver targeted retention measures instead of reacting to a decision that has already been made (Acceleraid Platform ↗). The scores themselves are designed to be explainable and auditable — a requirement that is becoming increasingly important given growing regulatory demands on automated models in banking.
From detection to automated retention campaigns
A prediction is only as good as the action it triggers. Acceleraid's CLM/CVM orchestration combines churn propensity scores with the respective lifecycle phase, the customer's known channel preferences, and commercial and regulatory guidelines to derive the next best action — delivered in real time via online banking, app, email, or branch CRM (Acceleraid Banking ↗). This is what distinguishes an operationally usable churn score from a pure reporting metric: as soon as a customer exceeds a defined risk threshold, a suitable campaign can be triggered automatically — such as a personalized offer, a proactive invitation to a consultation, or a targeted recommendation for a previously unused product, aligned with contact frequency limits so customers are not overwhelmed with conflicting or too frequent communications.
The following overview maps the four escalation stages to typical signal patterns and action options:
Phase | Time Horizon | Typical Signal | Action Option |
|---|---|---|---|
Baseline | Ongoing | Stable transaction frequency, stable balance | Standard monitoring |
Early Signal | T−90 days | Initial declines in login/transactions | Prediction Engine flags increased risk |
Escalation | T−60 days | Multiple signals deteriorate simultaneously | Automated retention trigger |
Critical | T−30 days | Outflow of balance, minimal digital activity | Personal consultation, targeted offer |
Conclusion: Retention starts before the cancellation
Silent attrition shows that the majority of churn in retail banking does not manifest as a formal cancellation, but as a gradual withdrawal — and that classic retention triggers, which only activate upon account closure, are systematically too late. The economic leverage of retention is well documented; what is often missing is not the awareness of the problem, but the ability to translate early signals within a 90-day window into concrete, cross-channel actions. How this retention phase is embedded into a complete lifecycle orchestration — including the reactivation of dormant customers who have not yet churned — is shown in the final Part 5 of this series.
Five key takeaways
Attrition often appears first as a change in behaviour.
An early-warning model needs a bank-specific target definition and temporal validation.
High model performance on a test set does not replace operational calibration.
Risk becomes valuable only through a permitted, cause-related action.
Retention must be measured incrementally against a control group.
Illustration: AI-generated. AI-supported content: In creating our articles, we use AI technologies and automated agents, including those from Microsoft, Google, OpenAI, Anthropic, and other providers. Topics, professional direction, and final approval remain with our team.
