Data & Technology
How much does a Customer Data Platform for financial service providers cost? TCO and Business Case
How much does a Customer Data Platform for financial service providers cost? TCO drivers, list prices, and ROI frameworks with proven figures.
•
acceleraid Editorial Team
6 min. read
01
Acquire
Recognize signals
02
Onboard
Control activation
03
Grow
Next Best Action
04
Retain
Reduce churn
05
Reactivate
Reclaim potential

Part 3 and conclusion of our series on Customer Data Platforms in the financial sector. Part 1 clarified definition and architecture, Part 2 the selection criteria. This part calculates what a Customer Data Platform actually costs for financial service providers and what business case it justifies.
How much does a Customer Data Platform cost for financial service providers? The short answer: license costs are usually not the largest item — usage models, services, and growth in data volumes determine the actual Total Cost of Ownership (TCO) far more than the list price. Anyone calculating a CDP investment for financial service providers therefore needs an understanding of the TCO drivers and a robust ROI framework — not just a look at the price list.
Published List Prices as a Guide
Two publicly accessible pricing models show the range. Twilio Segment Connections offers a free tier up to 1,000 Monthly Tracked Users (MTU), a team tier including 10,000 MTUs starting at 120 USD/month, and an individually priced business tier for higher volumes (Twilio, Connections Pricing). For additional MTUs, tiered pricing applies: 12 USD per additional 1,000 MTUs in the 10,000–25,000 range, 11 USD in the 25,000–100,000 range, and 10 USD starting at 100,000 MTUs, with up to 20% discount for annual payment (Twilio, Connections Pricing). A publicly visible enterprise price point is 108,000 USD per 12 months for up to 1 million MTUs/year, with an overage of 0.01 USD per additional unit (AWS Marketplace, Twilio Segment).
Salesforce Data 360 prices via Flex Credits: 500 USD per 100,000 Flex Credits, plus tiered Profile Editions — 240 USD per 1,000 profiles/year in the Standard version (including 1 Flex Credit per profile) and 420 USD per 1,000 profiles/year in the Enterprise version (including 2 Flex Credits per profile, plus Data Masking and Ad Audience Add-on) (Salesforce, Data 360 Pricing). Ingestion is free of charge in the Profiles Editions; functions such as "Prep, Harmonize & Unify", "Segment & Activate", and "Streaming & Real-Time", on the other hand, are billed based on usage via Flex Credits (Salesforce, Data 360 Pricing). Both pricing models are snapshots from August 2026 and should be dated with any calculation.
The Real Cost Driver: The MTU Definition
The largest, often underestimated cost lever lies in the definition of the billing unit itself. An MTU counts as a unique userId plus each unique anonymousId that was not mapped to any userId during the billing period — anonymous website visitors therefore cost money directly in this model (Twilio Segment Docs, MTUs & Throughput). A lack of identity resolution concretely doubles the costs: an unauthenticated person with one anonymousId each on web and app counts as 2 MTUs; if they log in on both channels, they only count as 1 MTU (Twilio Segment Docs).
A second, independent volume axis is throughput: the permissible volume is calculated as (ingested objects plus API calls) divided by the MTU quota — with a limit of 250 and a 10,000 MTU plan, that is 2.5 million API calls and objects per month (Twilio Segment Docs). Important for the calculation: batching does not reduce consumption, as batched individual calls are counted separately, and deduplicated or repeatedly retrieved records from cloud source syncs also each count as a separate object (Twilio Segment Docs).
Services, Training, and Staffing Often Exceed Software Costs
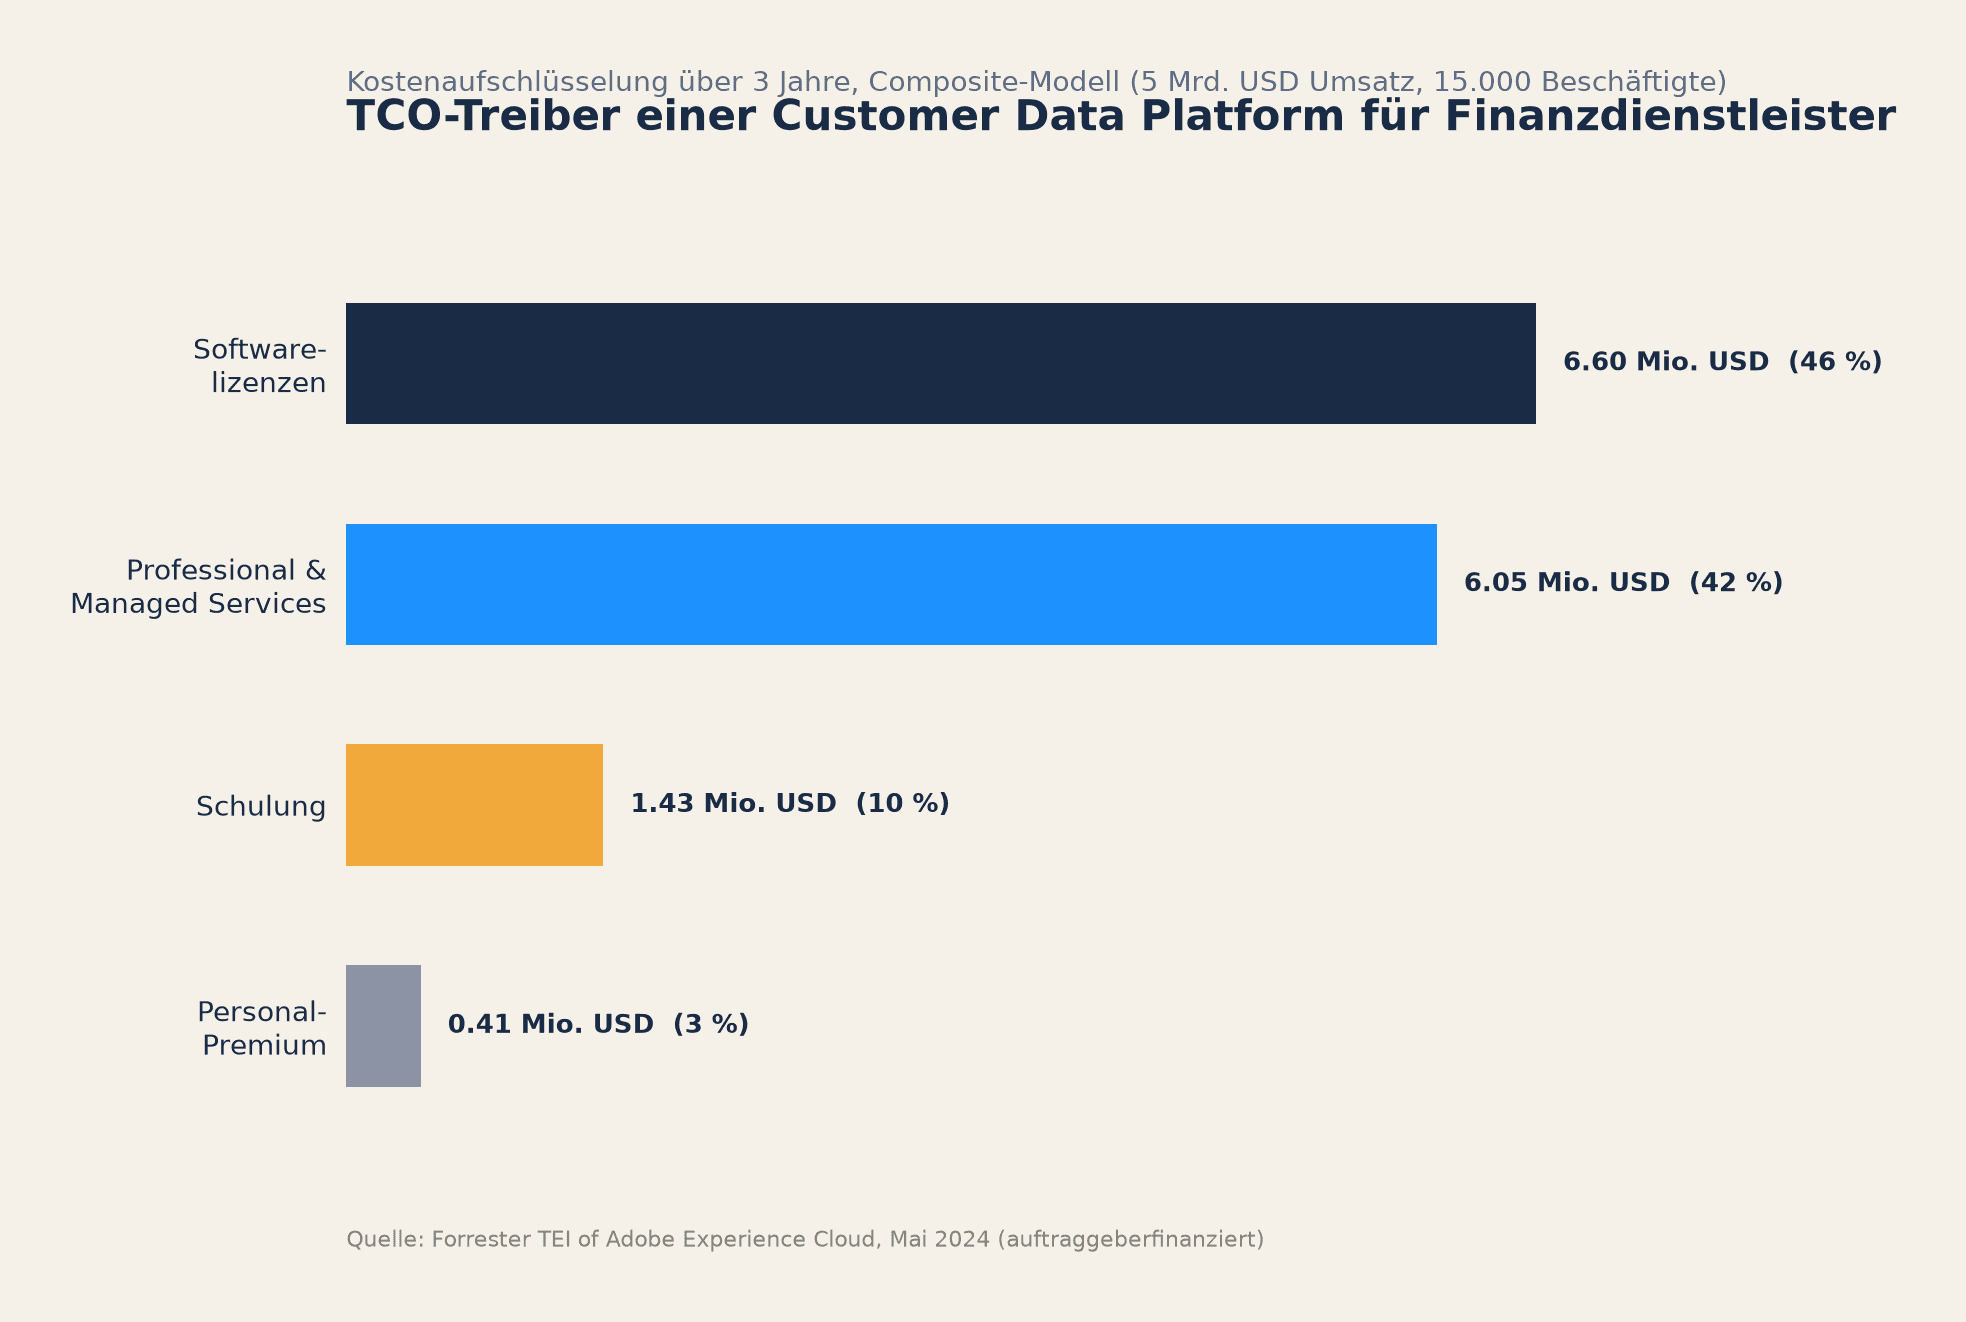
An independent Forrester TEI study on Adobe Experience Cloud provides a rare breakdown of non-license costs over three years: 6.6 million USD in software costs are offset by 6.05 million USD for ongoing professional and managed services (including 2.75 million USD in initial costs), plus 1.43 million USD in training costs and 411,840 USD in premium costs for new hires — a total of 14.49 million USD (Forrester TEI of Adobe Experience Cloud, May 2024). Services, training, and staffing thus make up more than half of the total costs — a pattern that typically applies to CDP projects in the financial sector with their complex core banking system integrations.
Cost Category | Share of Total Costs (Forrester Model) | Source |
|---|---|---|
Software Licenses | 6.6 million USD of 14.49 million USD | |
Professional & Managed Services | 6.05 million USD of 14.49 million USD | |
Training | 1.43 million USD of 14.49 million USD | |
Premium Staffing Costs | 411,840 USD of 14.49 million USD |
Source: Forrester TEI of Adobe Experience Cloud, May 2024 (commissioned study, methodologically documented).
Evidence of ROI: What Commissioned Studies Actually Show
Two Forrester TEI studies on Adobe products provide the most detailed publicly available ROI figures for CDP-related investments — both are to be marked as commissioned. The first points to a combined ROI of 431% with a payback of under 6 months for CDP, Journey Orchestration, and Analytics, with a three-year present value of benefits of 16.2 million USD and a reported revenue gain of 534 million USD (Forrester TEI of Adobe Real-Time CDP, August 2023). The second, more comprehensive study on Adobe Experience Cloud indicates a 333% ROI, with a net present value (NPV) of 41.5 million USD, present value of benefits of 53.9 million USD, and present value of costs of 12.4 million USD, also with a payback under 6 months (Forrester TEI of Adobe Experience Cloud, May 2024).
For your own, more conservative business case calculation, the same study provides applicable model assumptions: an increase in blended conversion from a 2.0% baseline to 2.20% / 2.25% / 2.30% in years 1 to 3, an attribution of 40% of digital conversions to the platform, a profit margin on digital conversions of 10%, and a retention improvement of 3% / 5% / 6% (Forrester TEI, May 2024).
Banking-Specific Business Case Anchors
For the banking perspective, independent, non-commissioned figures are the better starting point. BCG calculates: "for every $100 billion in assets that a bank has, it can achieve as much as $300 million in revenue growth" through personalization (BCG, 2019). McKinsey names a more conservative but more broadly supported uplift anchor: personalization usually drives a revenue increase of 10 to 15%, and up to 5 to 25% depending on the company (McKinsey, Next in Personalization 2021). On the cost side, a separate McKinsey explainer shows that personalization can reduce customer acquisition costs by up to 50%, increase revenues by 5 to 15%, and increase marketing ROI by 10 to 30% (McKinsey, What is personalization?, 30.05.2023).
A Simple TCO Framework for Your Own Calculation
A pragmatic calculation framework can be derived from the mentioned facts:
License and Usage Costs: Project MTU- or credit-based models with realistic growth of the user base over 3 years, including the identity resolution effect on the billing unit.
Implementation and Service Expenses: Calculate using the Forrester pattern with at least the same order of magnitude as the software costs, especially for core banking system integrations.
Training and Staffing: Plan this as a separate line item, not as a residual amount in the project budget.
Expected Revenue Effect: Calculate conservatively with the McKinsey anchor of a 10 to 15% uplift, or more optimistically with the BCG anchor of 300 million USD per 100 billion USD in assets.
Payback Target: The publicly documented TEI studies show a payback of under 6 months as an achievable reference value for CDP-related investments — although this should be interpreted as an upper limit and not as a standard case, since it is commissioned.
Acceleraid positions itself here with a concrete reference value for an integrated CDP and CLM/CVM model in banking: an ROI in 6 to 9 months (Acceleraid Platform) — a timeframe that fits within the range mentioned above, without adopting the commissioned extreme values.
Conclusion of the Series
The three parts of this series paint a coherent picture: A Customer Data Platform for financial service providers is first a regulatory and architectural decision, then a structured selection question — and only at the very end a cost calculation. Anyone who reverses the order and starts with the price will generally make the wrong decision, because regulatory exclusion criteria and governance gaps only reveal themselves as hidden costs after the fact. Anyone who instead goes through architecture, criteria catalog, and TCO framework in that order can justify the business case for a CDP in the financial sector in a robust and comprehensible manner.
Illustration: AI-generated. AI-assisted content: In creating our articles, we use AI technologies and automated agents, including from Microsoft, Google, OpenAI, Anthropic, and other providers. Topics, professional alignment, and final approval remain with our team.
Further Insights
We use cookies 🍪
Strictly necessary cookies (e.g. Pipedrive forms) remain active. With your consent, we also use Google Analytics (analytics) and Leadfeeder (visitor identification). Learn more in our Privacy Policy.